Anexo:Ciudades de Australia por población
Esta lista de ciudades de Australia por población proporciona una clasificación de ciudades y pueblos australianos según todas las «áreas urbanas significativas» (en inglés: Significative Urban Areas; SUA) definidas por la Oficina Australiana de Estadística. Las SUA se definen para representar pueblos y ciudades significativos (o aglomeraciones de pueblos más pequeños, que tienen al menos 10 000 habitantes totales) con fines de análisis estadístico y no coinciden con los límites legales o administrativos oficiales.[1]
Áreas urbanas significativas de más de 10 000 habitantes
A continuación, se clasifican las «áreas urbanas significativas», incluidas las de las capitales, según datos estadísticos oficiales de la Oficina Australiana de Estadística al 30 de junio de 2021.[2] Las capitales aparecen en negrita.
El 70 % de la población australiana vive en las ocho ciudades más pobladas.
.jpg.webp)
| Puesto | Área urbana significativa | Estado/territorio | Población residente estimada | Crecimiento | |
|---|---|---|---|---|---|
| Junio de 2021[2] | Junio de 2016[2] | ||||
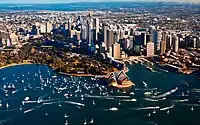
| 1 | Sídney | 4 959 107 | 4 637 436 | +6.94% | |
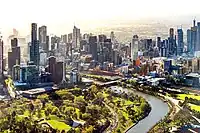
| 2 | Melbourne | 4 901 863 | 4 546 593 | +7.81% | |
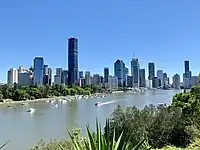
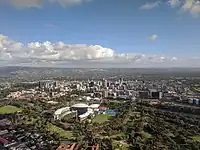
| 3 | Brisbane | 2 495 825 | 2 282 759 | +9.33% | |
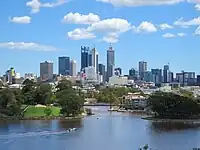
| 4 | Perth | 2 099 530 | 1 982 270 | +5.92% | |
| 5 | Adelaida | 1 359 087 | 1 305 526 | +4.10% | |
| 6 | Gold Coast–Tweed Heads | 718 772 | 645 711 | +11.31% | |
| 7 | Newcastle–Maitland | 505 489 | 475 716 | +6.26% | |
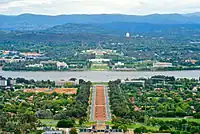
| 8 | Canberra–Queanbeyan | 462 984 | 439 971 | +5.23% | |
| 9 | Sunshine Coast | 353 906 | 316 905 | +11.68% | |
| 10 | Central Coast | 338 567 | 328 330 | +3.12% | |
| 11 | Wollongong | 312 167 | 294 784 | +5.90% | |
| 12 | Geelong | 287 704 | 254 296 | +13.14% | |
| 13 | Hobart | 218 386 | 207 396 | +5.30% | |
| 14 | Townsville | 184 271 | 178 244 | +3.38% | |
| 15 | Cairns | 155 529 | 149 182 | +4.25% | |
| 16 | Toowoomba | 140 303 | 133 654 | +4.97% | |
| 17 | Darwin | 132 921 | 133 098 | -0.13% | |
| 18 | Ballarat | 111 348 | 101 678 | +9.51% | |
| 19 | Bendigo | 103 575 | 95 934 | +7.96% | |
| 20 | Albury–Wodonga | 97 274 | 90 836 | +7.09% | |
| 21 | Launceston | 88 884 | 85 732 | +3.68% | |
| 22 | Mackay | 81 262 | 80 411 | +1.06% | |
| 23 | Rockhampton | 79 967 | 78 598 | +1.74% | |
| 24 | Melton | 77 392 | 61 960 | +24.91% | |
| 25 | Bunbury | 75 440 | 73 678 | +2.39% | |
| 26 | Coffs Harbour | 73 443 | 70 106 | +4.76% | |
| 27 | Bundaberg | 71 796 | 70 179 | +2.30% | |
| 28 | Wagga Wagga | 57 004 | 55 800 | +2.16% | |
| 29 | Hervey Bay | 56 599 | 53 016 | +6.76% | |
| 30 | Shepparton–Mooroopna | 52 273 | 50 708 | +3.09% | |
| 31 | Mildura–Wentworth | 51 794 | 51 051 | +1.46% | |
| 32 | Port Macquarie | 50 365 | 46 376 | +8.60% | |
| 33 | Gladstone–Tannum Sands | 45 987 | 44 954 | +2.30% | |
| 34 | Tamworth | 43 330 | 41 986 | +3.20% | |
| 35 | Traralgon–Morwell | 42 567 | 41 385 | +2.86% | |
| 36 | Warragul–Drouin | 42 115 | 35 523 | +18.56% | |
| 37 | Bowral–Mittagong | 41 454 | 38 653 | +7.25% | |
| 38 | Orange | 41 162 | 39 586 | +3.98% | |
| 39 | Busselton | 41 034 | 37 690 | +8.87% | |
| 40 | Dubbo | 39 363 | 37 118 | +6.05% | |
| 41 | Nowra–Bomaderry | 38 947 | 36 790 | +5.86% | |
| 42 | Bathurst | 38 087 | 35 878 | +6.16% | |
| 43 | Geraldton | 37 228 | 38 369 | -2.97% | |
| 44 | Warrnambool | 35 957 | 34 615 | +3.88% | |
| 45 | Albany | 34 612 | 33 784 | +2.45% | |
| 46 | Devonport | 30 883 | 29 900 | +3.29% | |
| 47 | Mount Gambier | 29 940 | 29 532 | +1.38% | |
| 48 | Nelson Bay | 28 752 | 27 459 | +4.71% | |
| 49 | Kalgoorlie–Boulder | 28 565 | 30 652 | −6.81% | |
| 50 | Lismore | 28 469 | 29 016 | -1.89% | |
| 51 | Victor Harbor–Goolwa | 28 059 | 26 154 | +7.28% | |
| 52 | Maryborough | 27 583 | 27 240 | +1.26% | |
| 53 | Burnie–Wynyard | 27 519 | 26 978 | +2.01% | |
| 54 | Ballina | 27 380 | 25 643 | +6.77% | |
| 55 | Morisset–Cooranbong | 26 868 | 24 207 | +10.99% | |
| 56 | Alice Springs | 26 476 | 26 518 | -0.16% | |
| 57 | Taree | 26 343 | 26 385 | -0.16% | |
| 58 | Goulburn | 24 464 | 23 415 | +4.48% | |
| 59 | Bacchus Marsh | 24 443 | 20 989 | +16.46% | |
| 60 | Armidale | 24 194 | 24 114 | +0.33% | |
| 61 | Gisborne–Macedon | 22 681 | 21 011 | +7.95% | |
| 62 | Gympie | 22 068 | 21 315 | +3.53% | |
| 63 | Echuca–Moama | 21 994 | 20 848 | +5.50% | |
| 64 | Whyalla | 21 230 | 22 432 | −5.36% | |
| 65 | Forster–Tuncurry | 21 042 | 20 855 | +0.90% | |
| 66 | Griffith | 20 599 | 19 709 | +4.52% | |
| 67 | St Georges Basin–Sanctuary Point | 20 213 | 18 545 | +8.99% | |
| 68 | Yeppoon | 19 870 | 18 539 | +7.18% | |
| 69 | Wangaratta | 19 558 | 18 940 | +3.26% | |
| 70 | Murray Bridge | 19 484 | 18 196 | +7.08% | |
| 71 | Grafton | 19 037 | 18 359 | -0.35% | |
| 72 | Camden Haven | 18 942 | 17 001 | +11.42% | |
| 73 | Mount Isa | 18 080 | 19 271 | −6.18% | |
| 74 | Karratha | 17 558 | 16 363 | +7.30% | |
| 75 | Broken Hill | 17 230 | 18 114 | −4.88% | |
| 76 | Ulladulla | 17 199 | 15 618 | +10.12% | |
| 77 | Batemans Bay | 16 891 | 16 381 | +3.11% | |
| 78 | Moe–Newborough | 16 841 | 16 840 | +0.01% | |
| 79 | Horsham | 16 705 | 16 462 | +1.48% | |
| 80 | Port Lincoln | 16 529 | 16 198 | +2.04% | |
| 81 | Singleton | 16 147 | 16 517 | -2.24% | |
| 82 | Yanchep | 15 742 | 12 169 | +29.36% | |
| 83 | Bairnsdale | 15 705 | 14 899 | +5.41% | |
| 84 | Kempsey | 15 463 | 15 125 | +2.23% | |
| 85 | Sale | 15 388 | 14 891 | +3.34% | |
| 86 | Warwick | 15 223 | 15 395 | -1.12% | |
| 87 | Port Hedland | 15 050 | 14 411 | +4.43% | |
| 88 | Ulverstone | 14 613 | 14 402 | +1.47% | |
| 89 | Emerald | 14 489 | 13 867 | +4.49% | |
| 90 | Broome | 14 333 | 14 535 | -1.39% | |
| 91 | Port Pirie | 13 990 | 14 347 | -2.49% | |
| 92 | Port Augusta | 13 239 | 14 053 | -5.79% | |
| 93 | Lithgow | 12 756 | 13 040 | -2.18% | |
| 94 | Mudgee | 12 666 | 12 019 | +5.38% | |
| 95 | Colac | 12 474 | 12 450 | +0.19% | |
| 96 | Muswellbrook | 12 210 | 12 376 | -1.34% | |
| 97 | Esperance | 12 036 | 12 355 | -2.58% | |
| 98 | Parkes | 11 106 | 11 251 | -1.29% | |
| 99 | Swan Hill | 10 899 | 11 079 | -1.62% | |
| 100 | Portland | 10 832 | 10 943 | +1.01% | |
| 101 | Kingaroy | 10 286 | 10 464 | -1.70% | |
Véase también
Referencias
- Oficina Australiana de Estadística (10 de mayo de 2022). «Significant Urban Areas, Urban Centres and Localities, Section of State». www.abs.gov.au (en inglés). Consultado el 26 de diciembre de 2022.
- Oficina Australiana de Estadística. «Population estimates by LGA, Significant Urban Area, Remoteness Area and electoral division, 2001 to 2021». abs.gov.au (en inglés). Consultado el 30 de marzo de 2022.